Week of December 5, 2022 KPI Summary
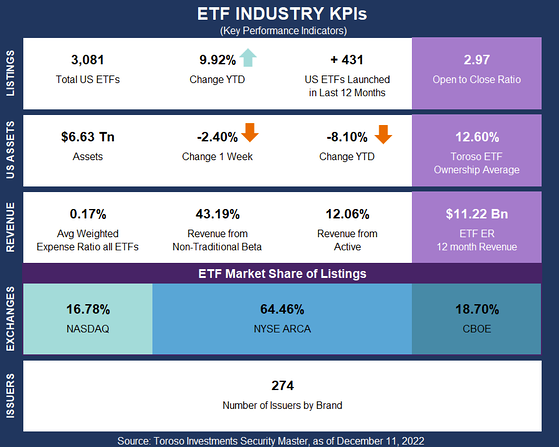
- This week, the industry experienced 9 ETF launches and 2 closures, shifting the 1-year Open-to-Close ratio to 2.97 and total US ETFs to 3,081.
- This time of year, while everything is merry and bright, everyone seems to come down with a cold. The chill in the air sets in and noses start to run like clockwork. Wisely placed on the calendar, December 12th is “National Universal Health Coverage Day”, and we are going to do a ‘check-up’ on the Healthcare ETFs.
- Our ETF Security Master categorizes 47 ETFs as Healthcare, and they combine for $105 Billion in assets.
- The largest Healthcare ETF by far is XLV (Health Care Select Sector SPDR ETF) at $42.7 Billion, with VHT (Vanguard Health Care ETF) next in line at $17.5 Billion.
- The 47 ETFs have averaged performance of -16.2% YTD and -0.2% over the last 3 months.
- The top performing Healthcare ETF YTD is FTXH, First Trust Nasdaq Pharmaceuticals ETF, at 3.0%.
- The average expense ratio for Healthcare ETFs is 0.54 compared to the industry average of 0.42.
- 19 different issuers have a Healthcare related ETF.
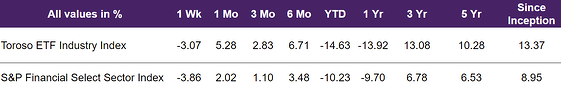
- The tracked indexes had similar experiences in the past week. The Toroso ETF Industry Index was down -3.07% while the S&P Financial Select Sector Index trailed at -3.86%.
ETF Launches
Gateway Senior Secured Credit Opportunities ETF (ticker: SECD)
Invesco AAA CLO Floating Rate Note ETF (ticker: ICLO)
Invesco High Yield Select ETF (ticker: HIYS)
Invesco Municipal Strategic Income ETF (ticker: IMSI)
Invesco Short Duration Bond ETF (ticker: ISDB)
Dimensional Global Real Estate ETF (ticker: DFGR)
Dimensional US Large Cap Value ETF (ticker: DFLV)
Q3 All-Season Active Rotation ETF (ticker: QVOY)
TrueShares Eagle Global Renewable Energy Income ETF (ticker: RNWZ)
ETF Closures
ETFMG 2X Daily Inverse Alternative Harvest ETF (ticker: MJIN)
Genuine Investors ETF (ticker: GCIG)Fund/Ticker Changes
None
TETF.Index Performance vs. S&P Financial Select Sector Index
(as of December 9, 2022)
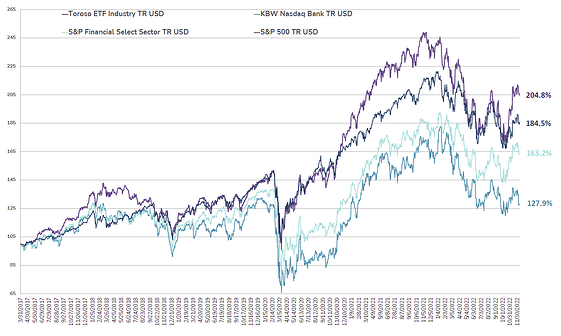
Source: Morningstar Direct
Why Follow the ETF Industry KPIs
The team at Toroso Investments began tracking the ETF Industry Key Performance Indicators (KPI’s) in the early 2000’s and have been consistently reporting on, and analyzing these metrics ever since. The table above was the impetus for the creation of the TETF.Index, the index that tracks the ETF industry. Each week, we will share the statistics we believe to be the most useful for identifying industry trends, in addition to the performance of the TEFT.Index.
DISCLAIMER
Past performance is no guarantee of future returns. This article is for informational and educational purposes only; is not intended to constitute legal, tax, accounting or investment advice; and does not constitute an offer to sell or a solicitation of an offer to buy any security or service. Furthermore, the Indexes shown above are not investable. While Toroso has gathered the information presented from sources that it believes to be reliable, Toroso cannot guarantee the accuracy or completeness of the information presented and the information presented should not be relied upon as such. Any opinions expressed are Toroso’s opinions and do not reflect the opinions of any affiliates or related persons. All opinions are current only as of the date of initial publication and are subject to change without notice. All investment strategies and investments involve risk of loss, including the possible loss of all amounts invested.
Topics: ETF Industry KPI’s