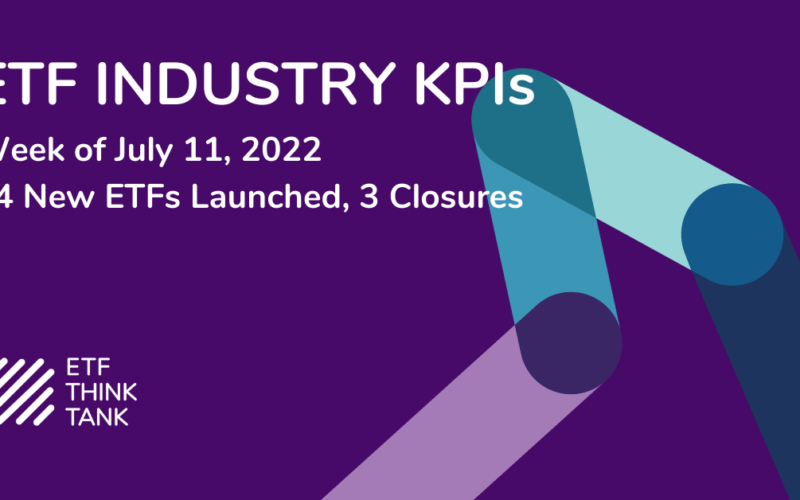
Week of July 18, 2022 KPI Summary
- This week, the industry experienced zero ETF launches and 3 closures, shifting the 1-year Open-to-Close ratio to 4.10 and total US ETFs to 2,977.
- Let’s take a ten-thousand-foot view at the industry as a whole and how the “average ETF” really stacks up in today’s ETF universe.
- In the ETF universe, there are now 2,977 funds with Equity and Fixed Income making up over 76% of the total. Additionally, of the approximate $6.4 Trillion in assets, Equity and Fixed Income funds constitute 95.1% of assets.
- When we break this down even more, the average AUM of an ETF today is $2.15 Billion. Surprisingly, the highest average AUM per fund in our categories is Commodities Physical with an average of $5.15 Billion AUM per fund, and Equity funds in a distant second place ($2.74 Billion). For context, Commodities Physical has ~$108 Billion across 21 funds.
- Of the current top 100 ETFs based on AUM, 69 are Equity, 27 are Fixed Income, 2 are Commodities Physical, 1 is Preferred Stock, and the final one is Geared/Swaps.
- Although the average fund has $2.15 Billion AUM, the mean is a $100 Million fund since the industry is quite top heavy. In fact, a $2.15 Billion fund would rank 360th of the 2,977 funds.
- Both indexes experienced minimal change last week. The Toroso ETF Industry Index was up 3.97% while the S&P Financial Select Sector Index trailed at 2.91%.

ETF Launches
None
ETF Closures
ADVR US LargeCap ESG ETF (ticker: AVDG)
AVDR US LargeCap Leading ETF (ticker: AVDR)
First Trust S-Network Healthcare Technology ETF (ticker: IMED)
Fund/Ticker Changes
Ecofin Digital Payments Infrastructure Fund (ticker: TPAY)
became Ecofin Digital Payments Infrastructure Fund (ticker: ETPA)
TETF.Index Performance vs. S&P Financial Select Sector Index
(as of July 22, 2022)

TETF.Index Performance vs. Other Leading Financial Indices
(March 31, 2017 through July 22, 2022)

Source: Morningstar Direct
Why Follow the ETF Industry KPIs
The team at Toroso Investments began tracking the ETF Industry Key Performance Indicators (KPI’s) in the early 2000’s and have been consistently reporting on, and analyzing these metrics ever since. The table above was the impetus for the creation of the TETF.Index, the index that tracks the ETF industry. Each week, we will share the statistics we believe to be the most useful for identifying industry trends, in addition to the performance of the TEFT.Index.
DISCLAIMER
Past performance is no guarantee of future returns. This article is for informational and educational purposes only; is not intended to constitute legal, tax, accounting or investment advice; and does not constitute an offer to sell or a solicitation of an offer to buy any security or service. Furthermore, the Indexes shown above are not investable. While Toroso has gathered the information presented from sources that it believes to be reliable, Toroso cannot guarantee the accuracy or completeness of the information presented and the information presented should not be relied upon as such. Any opinions expressed are Toroso’s opinions and do not reflect the opinions of any affiliates or related persons. All opinions are current only as of the date of initial publication and are subject to change without notice. All investment strategies and investments involve risk of loss, including the possible loss of all amounts invested.