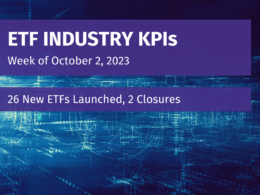
Week of June 13, 2022 KPI Summary
- This week, the industry experienced 4 ETF launches and 2 closures, shifting the 1-year Open-to-Close ratio to 4.61 and total US ETFs to 2,950.
- Tuesday is the first day of Summer! Let’s take a look at how the ETF industry recoiled during Spring 2022 (data compares March 20, 2022, to June 19, 2022).
- 2.15% increase in total US ETFs (+62), but a -13.04% decrease in total assets (approximately $912 Bn).
- From our 11 asset class categories, Managed Futures increased the most (93.29%) and Geared/Swaps had the largest drop (-23.10%). The two largest asset classes of Equity (75.62% of assets) and Fixed Income (19.04%) both declined -15.78% and -2.23% respectively.
- -13.74% decrease in ETF expense ratio 12-month revenue.
- Revenue from Active ETFs shot up from 10.92% to 11.64%.
- 5 additional issuers by brand.
- Spring of 2022 was a stormy and blustery season for Equity assets and most asset categories. ETF listings and issuers have increased at a slower rate than the last few seasons, but the open-to-close ratio remains high at 4.61. We’ll see if these trends continue into the Summer and if the ETF industry burns out or heats up.
- The tracked indexes had similar poor experiences over the Spring. Toroso ETF Industry Index was down -20.98% while the S&P Financial Select Sector Index led at -20.19%.

ETF Launches
JPMorgan International Research Enhanced Equity ETF (ticker: JIRE)
FT Cboe Vest Fund of Nasdaq-100 Buffer ETFs (ticker: BUFQ)
Optimize AI Smart Sentiment Event-Driven ETF (ticker: OAIE)
MicroSectorsTM Oil & Gas Exploration & Production -3X Inverse Leveraged ETNs (ticker: OILD)
ETF Closures
6.00% Notes due 2027 (ticker: SAT)
7.125% Notes dues 2027 (ticker: SCCF)
Fund/Ticker Changes
None
TETF.Index Performance vs. S&P Financial Select Sector Index
(as of June 17, 2022)

TETF.Index Performance vs. Other Leading Financial Indices
(March 31, 2017 through June 17, 2022)

Source: Morningstar Direct
Why Follow the ETF Industry KPIs
The team at Toroso Investments began tracking the ETF Industry Key Performance Indicators (KPI’s) in the early 2000’s and have been consistently reporting on, and analyzing these metrics ever since. The table above was the impetus for the creation of the TETF.Index, the index that tracks the ETF industry. Each week, we will share the statistics we believe to be the most useful for identifying industry trends, in addition to the performance of the TEFT.Index.
DISCLAIMER
Past performance is no guarantee of future returns. This article is for informational and educational purposes only; is not intended to constitute legal, tax, accounting or investment advice; and does not constitute an offer to sell or a solicitation of an offer to buy any security or service. Furthermore, the Indexes shown above are not investable. While Toroso has gathered the information presented from sources that it believes to be reliable, Toroso cannot guarantee the accuracy or completeness of the information presented and the information presented should not be relied upon as such. Any opinions expressed are Toroso’s opinions and do not reflect the opinions of any affiliates or related persons. All opinions are current only as of the date of initial publication and are subject to change without notice. All investment strategies and investments involve risk of loss, including the possible loss of all amounts invested.